Prediction model for Euro 2024
One of the most followed sport events on the planet, the UEFA European Championship, will be played this year. Euro 2024 is the 17th edition of the tournament, and it will take place in Germany, where 24 teams will compete to win the title of the best European National team. Italy is the reigning champions. They will have to fight strong competition like England, Spain, France and the host Germany. Who will come out on top? Who will be the surprise of the Championship?
Let’s have a look at the data we can get our hands on and try to build a prediction for the winner of the tournament, based on their past performance.
Getting the data
The Euro 2024 Qualifiers are a good place to look for the recent teams’ performance, and they represent a reliable dataset. These matches are competitive, and all teams play their strongest eleven, since the teams are looking to qualify to the tournament. They are also more reliable than older datasets, like the ones of the 2022 World Cup or the Euro 2020 final stage. Many of the teams have significantly changed their squads since those tournaments.
On the UEFA website we can access many statistics about the teams’ performance in the Qualifiers. For example, we can see all the data about goals scored, possession, passing accuracy and more. Unfortunately, there is no button or URL that we can use to download the data. A bit of research however shows that the UEFA website is using a public API to access those data in a machine-readable format. We can use this API and with a single HTTP request we get all the data presented in the page.
We can use the endpoint https://compstats.uefa.com/v1/team-ranking?competitionId=3 to get the information about all Euros competitions, and adding a few parameters like seasonYear and stats we can narrow down our search to the Euro 2024 only and select only the metrics that we are interested in.
I have downloaded and saved all data about the Euro 2020 Qualifiers, the Euro 2020 final stage and the Euro 2024 Qualifiers in my github repository. The data looks like this
| Team | attempts | attempts on target | … |
|---|---|---|---|
| Portugal | 193 | 81 | |
| France | 166 | 63 | |
| … | … | … | … |
These are the aggregated data and show the aggregated statistics for all teams that have participated in the Qualifiers to the Euro 2024 tournament, both the ones that qualified and the ones that didn’t qualify.
Transform and visualize the data
Some Euro 2024 Qualifiers groups were made up of 5 teams, some other had 6 teams. For this reason, the matches played by the teams are different. For example, Portugal played 10 matches during the campaign, while France only played 8. Moreover, the play-off system that some teams went through, made them play 2 matches more even if their group was made of 5 teams.
If we want to make a fair comparison of the teams, given that the dataset has aggregated data, it’s necessary to normalize them, by dividing everything for the number of matches played. So we can have an average of those metrics per match, that is unaffected by the number of matches played.
Once that is done, we will have a set of normalized metrics, like average attempts, average attempts on target and so on. We have that for all teams that went through the Qualifiers, so before visualizing the data it’s a good idea to filter only those teams that qualified to the final stage.
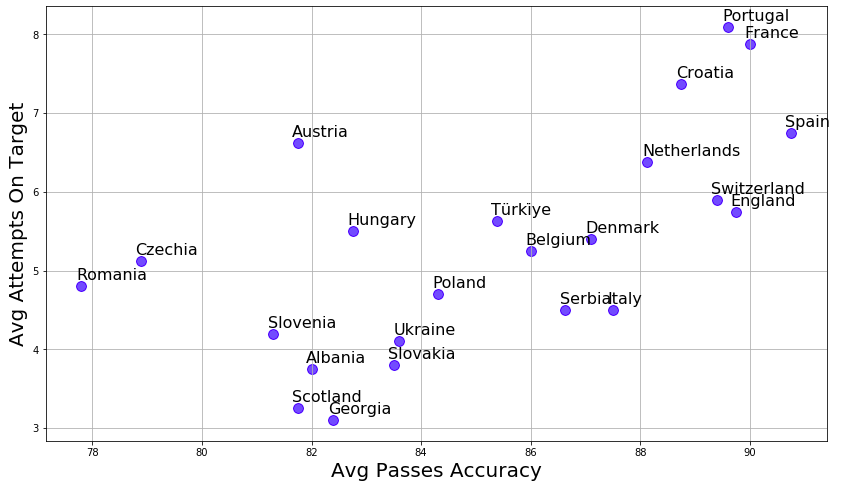
Once that is done, we can visualize the metrics. For example, below there is a 2D scatter plot that shows the correlation between the average pass accuracy and the number of attempts per match.

Building a ranking system
We have all the ingredients now to compare the teams and build a ranking metric that allows us to sort the teams from the strongest to the weakest. For example, we can ask ourselves, “What’s the team that scored most goals per match?” or “What’s the team with the most corners awarded?”. The answers to these questions might help us find out what are the best teams for a number of relevant statistics and then build a ranking system that employs all of them or a subset of them to build a final ranking metric.
Building a ranking metric can be done by sorting the teams by a specific metric, and then assigning 1 to the best team, 2 to the second-best team and so on. Ranking teams by number of goals scored per match gives us this table
| Team | Goals per match | Rank |
|---|---|---|
| France | 3.625 | 1 |
| Portugal | 3.6 | 2 |
| Spain | 3.125 | 3 |
| Belgium | 2.75 | 4.5 |
| England | 2.75 | 4.5 |
Here you can see that France is on top, so it gets rank 1. Portugal is second, so it gets rank 2 and so on. Notice that in 4th and 5th place there are Belgium and England, with the same number of goals per match. In this case we share the rank between the two teams, so they get a 4.5 each.
Goals scored is just one of the several metrics that we have in our dataset and a more sophisticated ranking system should be able to combine several of them into one final statistics, that gives us the strength of the team. A simple and effective approach can be to just calculate the rank for every single one of the metrics in our dataset and consider the average rank. The team that comes out on top will be the favorite to win the Euro 2024 tournament.
Prediction of Euro 2024 winner
If you take all the metrics we have collected and rank all the teams according to each of the metrics, you will get several tables like the one above, one for each different metric. Now, from there, you can simply average all rankings for all metrics for all teams, and you will have a total average ranking, that will take into account every single statistics and the full offensive and defensive performance of all teams in the Euro 2024 Qualifiers.
We can then compare the average ranking, with the odds taken from oddsportal, identify the probable winner, and also some potential underdogs like Greece and Denmark have been in the past.
Let’s look at the result
| Team | Avg Rank | Odds |
|---|---|---|
| France | 12.8 | 4.88 |
| Portugal | 16.6 | 9.00 |
| Croatia | 16.7 | 41.00 |
| Spain | 17.5 | 9.00 |
| Netherlands | 18.2 | 17.00 |
| Denmark | 20 | 41.00 |
| Italy | 20.8 | 15.50 |
| Serbia | 21.3 | 74.00 |
| Türki̇ye | 21.5 | 51.00 |
| Czechia | 21.8 | 151.00 |
| Poland | 22 | 138.50 |
| England | 22.5 | 4.00 |
| Hungary | 23.2 | 81.00 |
| Belgium | 23.3 | 16.00 |
| Austria | 24.2 | 69.75 |
| Slovakia | 24.5 | 476.00 |
It looks like the betting odds are more or less in agreement with the ranking model, with a few notable exceptions. Croatia has much higher odds than our ranking model would imply. While England, and partially Belgium, have much lower odds than our model indicates. A good betting strategy before the Euro could be to take advantage of this ranking model and place a highly speculative bet on one of the teams with the low rank and high odds. Croatia, Denmark and Serbia look like good candidates to be the surprise of the tournament.
Conclusions
The above is only one of many possible approaches to try to predict the winner of the Euro 2024. One of the flaws of this approach is that it can only make predictions for the teams that have played the Qualifiers. The host team, Germany, qualified without playing them, and so it doesn’t show up in this ranking. In order to improve the model we could include also Germany data, for example for friendly matches. But they will not be as complete as the UEFA official data.
If you are interested in learning more about how to build a betting model for Euro 2024 and more, you can check out my books where I go into the details of how to get the data, visualize and train a model, complete with code examples.

