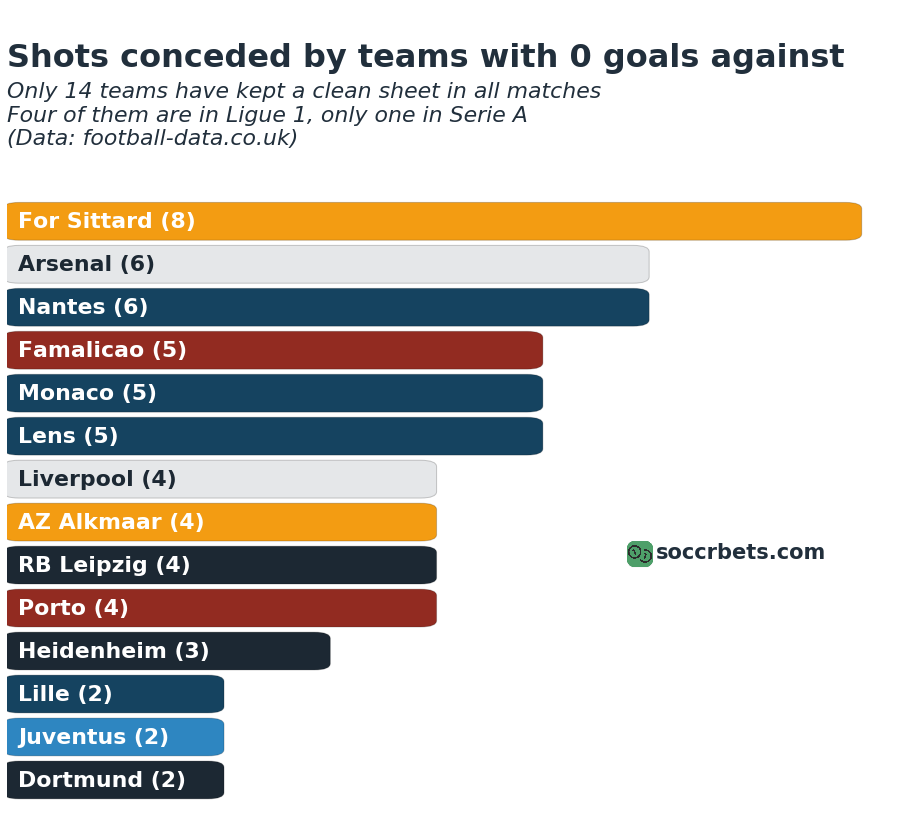
Shots conceded by the best defenses in the top European leagues
With the start of Bundesliga, all European leagues have finally kicked off the 2024/25 season. This means that we can now take a look at statistics for the first matches and draw some comparison between leagues and teams. It’s still too early to make final conclusions, but it can be definitely interesting to look at early trends.
In particular, I have noticed that quite a few teams have kept a clean sheet in all matches played so far. How good are their defenses? Is it because they are not conceding shots on target, or because their goalkeepers are world-class? To answer these questions, we need to
- select the teams that have not conceded a single goal (yet)
- calculate the number of shots on target conceded
- rank them by number of shots on target conceded
In this way, the teams that have outstanding goalkeepers will be ranked at the top, since they have saved the highest amount of shots on target.
In the article, I am going to outline the analysis process, from getting the data, to aggregating, visualizing and ranking the teams.
Getting the data
I have used the data available on football data website. Here you can find the detailed match statistics of all major European leagues (and more). In order to import one league, using pandas you can do:
df_epl = pd.read_csv("https://www.football-data.co.uk/mmz4281/2425/E0.csv")
Ar this point you can have a look at the data inside the file, and it will look something like this
| Date | HomeTeam | AwayTeam | FTHG | FTAG | … | AC |
|---|---|---|---|---|---|---|
| 16/08/2024 | Man United | Fulham | 1 | 0 | … | 8 |
| 17/08/2024 | Ipswich | Liverpool | 0 | 2 | … | 10 |
| 17/08/2024 | Arsenal | Wolves | 2 | 0 | … | 2 |
We have quite a big number of interesting statistics here. Apart from the full time goals, we can access shots, shots on target, corners and even yellow and red cards.
The next step is to aggregate the data from all European leagues. In order to do this, we will simply import them in a separate DataFrame first, and later concatenate those together.
df_epl = pd.read_csv("https://www.football-data.co.uk/mmz4281/2425/E0.csv")
df_bundes = pd.read_csv("https://www.football-data.co.uk/mmz4281/2425/D1.csv")
df_liga = pd.read_csv("https://www.football-data.co.uk/mmz4281/2425/SP1.csv")
df_seriea = pd.read_csv("https://www.football-data.co.uk/mmz4281/2425/I1.csv")
df_ligue1 = pd.read_csv("https://www.football-data.co.uk/mmz4281/2425/F1.csv")
df_ere = pd.read_csv("https://www.football-data.co.uk/mmz4281/2425/N1.csv")
df_pri = pd.read_csv("https://www.football-data.co.uk/mmz4281/2425/P1.csv")
Here we have imported the data from the top 7 European leagues (Premier League, Bundesliga, La Liga, Serie A, Ligue 1, Eredivisie and Primeira Liga). So now we can concatenate those into a single big one.
all_leagues = pd.concat([df_epl, df_liga, df_seriea, df_ligue1, df_ere, df_pri, df_bundes])
The all_leagues DataFrame will contain all matches played so far in the 7 leagues mentioned above.
We are now ready to calculate the total number of goals conceded by each team so far, and select only the teams that have not conceded a goal yet.
Calculating goals conceded
In order to calculate the number of goals conceded by each team, I will first define a function that, given a team name in input, will calculate the number of goals conceded by the team in all matches played so far. Once I have done that, I can apply that function to all teams in a loop and select only the ones that have conceded 0 goals.
The function to calculate the number of goals conceded by a single team looks like this
def calc_shotstop(team):

    team_matches = all_leagues[(all_leagues['HomeTeam']==team) | (all_leagues['AwayTeam']==team)]
    shots_ot_conceded = 0
    goals_conceded = 0
    for idx, row in team_matches.iterrows():
        if row['HomeTeam'] == team:
            shots_ot_conceded += row['AST']
            goals_conceded += row['FTAG']
        else:
            shots_ot_conceded += row['HST']
            goals_conceded += row['FTHG']

    if shots_ot_conceded>0:
        shot_stop_ratio = 1 - float(goals_conceded)/shots_ot_conceded
    else:
        shot_stop_ratio = 0

    div = row['Div']
    return shot_stop_ratio, goals_conceded, shots_ot_conceded, div
This function takes in input the name of a team team_name and outputs
goals_conceded: the number of goals conceded by the team so farshots_ot_conceded: the number of shots on target conceded by the team so farshot_stop_ratio: the number of shots on target stopped by the goalkeeperdiv: the division the team plays in
The calculation follows these steps:
- We slice the DataFrame selecting all rows where the name of the home or away team was the one given as input to the function. We call
team_matchesthis smaller DataFrame, since it contains only matches played by the team we are analyzing. - We initialize
goals_concededandshots_ot_concededto 0. - We loop on the
team_matchesDataFrame and, in case the team is playing at home, we add toshots_ot_concededthe value of the columnAST. If the team is playing away, we add toshots_ot_concededthe value of the columnHST. - In the same loop, in case the team is playing at home, we add to
goals_concededthe value of the columnFTAG. If the team is playing away, we add togoals_concededthe value of the columnFTHG. - We calculate the
shot_stop_ratioas 1 minus the ratio betweengoals_concededandshots_ot_conceded. In caseshots_ot_concededis 0, we setshot_stop_ratioto 0. - We return the
shot_stop_ratio,goals_conceded,shots_ot_concededanddiv, which is the code of the league.
This function is ready to use. For example, if we want to calculate the numbers for Man United we will simply call
calc_shotstop('Man United')
# output
(0.7142857142857143, 2, 7, 'E0')
The output means that the shot_stop_ratio for Man Utd was 78%, they conceded 2 goals so far, and they conceded 7 shots on target, 5 of which saved by Onana.
Let’s now calculate the above for all the teams. To do this we simply write
#calc shotstop ratio for all teams
# get all teams
all_teams = set(list(all_leagues['HomeTeam']) + list(all_leagues['AwayTeam']))

# loop on all teams and save the shotstop ratio
shotstop_allteams = []
for team in all_teams:
    shot_stop, goals, shots_ot, div = calc_shotstop(team)
    shotstop_allteams.append((team, shot_stop, goals, shots_ot, div))
We first get the names of all teams by creating a set made of the all the names in the HomeTeam and AwayTeam columns. In this way we are sure to collect all teams that have played home or away this season. We transform this into a set to eliminate the duplicates.
The second step, is to create a list shotstop_allteams that will contain the results of the calc_shotstop function, one entry for each team. Finally, we loop on the all_teams list and invoke the calc_shotstop function, giving it as an input the team name.
We are now ready to visualize these data.
Visualizing the data
The final step before visualizing the data consists in filtering only those teams that have conceded exactly 0 goals.
shotstop_allteams_cs = [x for x in shotstop_allteams if x[2]==0]
Here we save into a new list shotstop_allteams_cs (where cs stands for clean sheet) only the elements of shotstop_allteams that have their third element (the goals conceded) equal to 0.
We can now print shotstop_allteams_cs and we will see the names of the teams that have conceded 0 goals.
shotstop_allteams_cs

# output
[('For Sittard', 1.0, 0, 8, 'N1'),
 ('Arsenal', 1.0, 0, 6, 'E0'),
 ('Nantes', 1.0, 0, 6, 'F1'),
 ('Famalicao', 1.0, 0, 5, 'P1'),
 ('Monaco', 1.0, 0, 5, 'F1'),
 ('Lens', 1.0, 0, 5, 'F1'),
 ('Liverpool', 1.0, 0, 4, 'E0'),
 ('AZ Alkmaar', 1.0, 0, 4, 'N1'),
 ('RB Leipzig', 1.0, 0, 4, 'D1'),
 ('Porto', 1.0, 0, 4, 'P1'),
 ('Heidenheim', 1.0, 0, 3, 'D1'),
 ('Lille', 1.0, 0, 2, 'F1'),
 ('Juventus', 1.0, 0, 2, 'I1'),
 ('Dortmund', 1.0, 0, 2, 'D1')]
If we want to sort the list of the teams above by the ones that conceded more shots we can do the following.
shotstop_allteams_cs.sort(key=lambda x: x[3], reverse=True)
Where the key parameter is a lambda function, to specify that the third element (the number of shots on target conceded) needs to be taken into account as metric to rank the elements of shotstop_allteams_cs.
It’s now time to visualize those data. Below you can see a bar chart, that includes all the teams that have never conceded so far in this season, ordered by the number of shots on target conceded. The teams with the best goalkeepers should appear on the top, as their defenses have conceded shots, but their goalkeepers have been able to stop them successfully. We can see Arsenal with Raya is up top in second place, and Nantes’ Lafont seems also quite a good shot stopper.

I have written a few books where I go into the details of how to get the data, visualize and train a model to predict football results for the Premier League, La Liga, Serie A, Bundesliga and the other major European national tournaments, complete with code examples.

