Goals and shots in the top European leagues
Almost all the top European leagues have restarted last weekend, with only Bundesliga missing. I have had a look at the statistics from the first match day and compared the goals scored, and the shots made on average in each match. The goal is to understand if there are big differences in the football style between the leagues. Of course, it’s a bit early to have a meaningful statistical sample, so I will revisit the numbers every week to see how this evolves.
Here I will explain the analysis process, from getting the data, to aggregating and visualizing them.
Getting the data
I have used the data available on football data website. Here you can find the detailed match statistics of all major European leagues (and more). In order to import one league, using pandas you can do:
df_epl = pd.read_csv("https://www.football-data.co.uk/mmz4281/2425/E0.csv")
Ar this point you can have a look at the data inside the file, and it will look something like this
| Date | HomeTeam | AwayTeam | FTHG | FTAG | … | AC |
|---|---|---|---|---|---|---|
| 16/08/2024 | Man United | Fulham | 1 | 0 | … | 8 |
| 17/08/2024 | Ipswich | Liverpool | 0 | 2 | … | 10 |
| 17/08/2024 | Arsenal | Wolves | 2 | 0 | … | 2 |
We have quite a big number of interesting statistics here. Apart from the full time goals, we can access shots, shots on target, corners and even yellow and red cards. We could already use these data as they are, but for our purpose, we are going to aggregate those data and visualize the outcome.
Aggregating the data
To compare all different leagues, we first want to combine those data to get a single set of metrics (one set for each league). Then we can rank the leagues and compare them according to one or more of these metrics. The steps we will follow to aggregate the data are the followings:
- Get the total statistics for each match (summing the metrics for home and away team)
- Sum all the statistics across matches
- Average the statistics
Since all leagues have only played one match, we don’t really need to perform the second step yet. But once we will have more data it will be part of the aggregation process.
To get the total statistics for each match I have created a function that takes the data in input and adds multiple columns, simply combining the already existing ones.
def add_totals(df):

    df['tot_shots'] = df['HS'] + df['AS']
    df['tot_shots_ot'] = df['HST'] + df['AST']
    df['tot_fouls'] = df['HF'] + df['AF']
    df['tot_goals'] = df['FTHG'] + df['FTAG']
    df['tot_yellows'] = df['HY'] + df['AY']
    df['tot_reds'] = df['HR'] + df['AR']

    return df
The function is very simple. It takes the home and away metrics, sums them up and saves them in a separate column.
The next step is to calculate the average metrics. For example, let’s say we want to calculate the average number of goals per match. The full step is the following
df_epl = pd.read_csv("https://www.football-data.co.uk/mmz4281/2425/E0.csv")
df_epl = add_totals(df_epl)
avg_goals = df_epl['tot_goals'].mean()
We read the data, calculate the total metrics, access the total number of goals from the tot_goals column, and finally calculate the average goals by calling the mean() function.
Visualizing the data
We can do the above for every single league and every single interesting metric. I have looked at the Premier League, La Liga, Serie A, Eredivisie, Ligue 1, and Primeira Liga and this is the result for a few of them.
| League | Average shots | Average shots on target | Average goals | Average fouls |
|---|---|---|---|---|
| Serie A | 23 | 9.2 | 2.6 | 26 |
| Premier League | 23.9 | 8.1 | 2.1 | 24.6 |
| Ligue 1 | 20.4 | 8.7 | 2.5 | 23 |
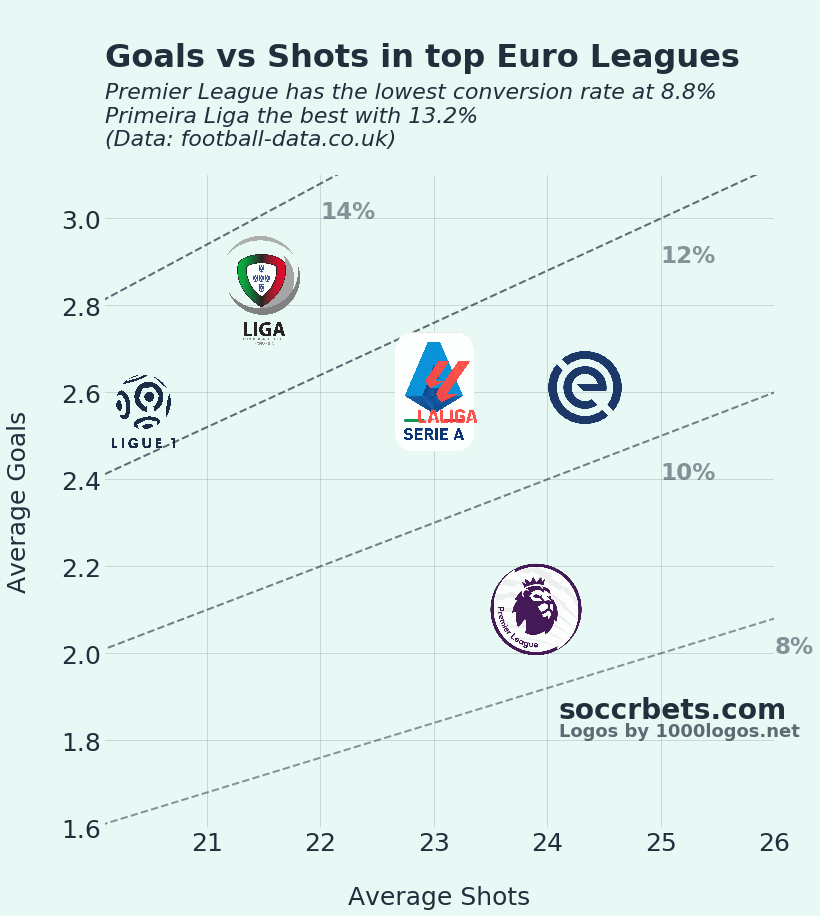
It’s now very easy to visualize those data. For example, we can make a scatter plot of goals vs shots for all leagues I mentioned above. This will give us an idea on how good are teas in the league at converting shots in goals.

The plot shows that the best performing league is the Primeira Liga, with 13% of the shots converted into goals. While the Premier League look to be the worst performing one, with only 8.8% of shots converted into goals. It looks like the Premier League might have an issue with the accuracy of the forwards, or maybe the shot quality might be not good enough, or it might be a matter of very good goalkeepers. I will try to investigate more in the issue in the next weeks, once we collect more data.
I have written a few books where I go into the details of how to get the data, visualize and train a model to predict football results for the Premier League, La Liga, Serie A, Bundesliga and the other major European national tournaments, complete with code examples.

